NASDAQ 100 CRASH: Our Forecast Was Right. Here’s a Reminder of Our Targets
 July 29, 2026 · Nitsan

The NASDAQ 100 decline followed the projected bearish scenario, bringing the previously identified downside targets back into focus.
Did Our Previous Analysis Call the Market Top?
On June 7, we published our NASDAQ 100 CRASH analysis, explaining why we believed the Nasdaq 100 was approaching a major technical reversal zone after an extended rally.
At the time, optimism remained extremely high. The AI-driven rally continued to dominate headlines, and many investors expected the index to push even higher. Our technical analysis suggested a different outcome. We believed the upside potential had become limited while the downside risk was increasing significantly.
Since then, the market has reversed sharply from the area we identified, confirming the first stage of our bearish outlook.
Technical analysis is never about predicting the future with certainty. Its purpose is to identify high-probability scenarios before they become obvious to the broader market.
Why Did We Expect A Reversal?
Our previous analysis was based on several technical factors aligning at the same time.
The Nasdaq 100 had completed a breakout from a large symmetrical triangle that had developed over many months. Once the breakout occurred, the index experienced an exceptionally strong rally, which eventually carried price into a major profit-taking zone on the monthly chart.
At the same time, the distance between price and the long-term monthly moving averages had become unusually large. Historically, this type of extension is often followed by periods of consolidation or meaningful corrections as institutional investors begin locking in profits.
When a major breakout is followed by an overextended rally into long-term resistance, the probability of a correction increases considerably.
What Does The Current Chart Show?
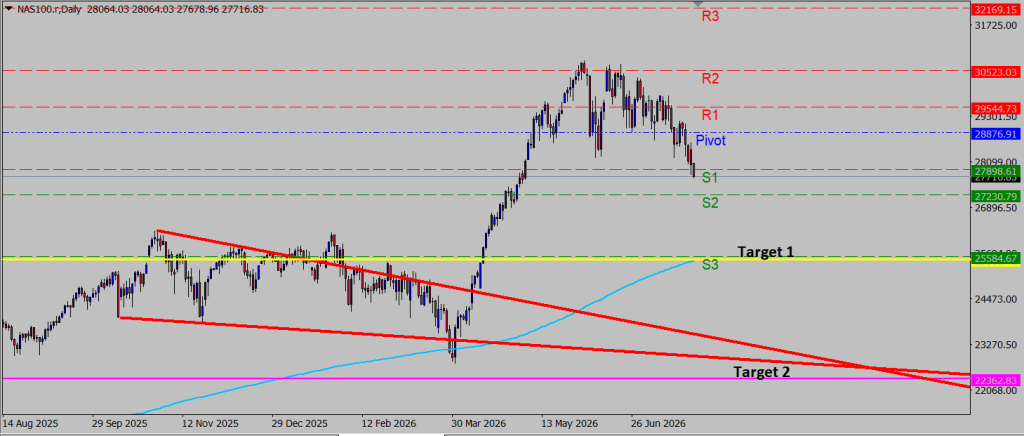
The chart continues to support our original outlook.
After breaking out from the symmetrical triangle, the Nasdaq 100 rallied directly into a significant monthly resistance and profit-taking area. This is exactly where we expected bullish momentum to begin fading.
Since reaching that zone, the index has reversed lower and has already broken below the monthly Pivot level and the S1 support level, indicating that sellers have started taking control.
Based on the current technical structure, we continue to believe that the correction is likely to extend toward our projected downside targets.
Why Is The Monthly Chart So Important?
Many traders focus primarily on daily price movements.
However, the monthly chart often reveals where long-term institutional investors begin taking profits after extended advances.
The recent decline did not begin randomly.
It started after the Nasdaq 100 reached a major monthly profit-taking area following one of the strongest rallies in recent years. Combined with the completed triangle breakout and the significant distance from the long-term moving averages, this created a high-probability reversal environment.
This was the foundation of our previous analysis, and so far the market has respected that technical structure remarkably well.
Target 1 Remains Our Primary Objective
Our first downside objective remains around 25,600.
This area coincides with the monthly S3 support level and represents a major long-term technical support zone. It is also close to an important area where buyers may attempt to regain control of the market.
For now, this remains our primary target.
What Happens If Target 1 Fails?
If selling pressure continues and the market fails to stabilize around our first objective, the next major downside target remains approximately 22,360.
This level aligns with another significant long-term support zone and represents the second major objective of our bearish scenario.
While no outcome is guaranteed, a decisive break below the first target would significantly increase the probability of a move toward the second objective.
Final Thoughts
The first stage of our forecast has already unfolded as expected.
The Nasdaq 100 reversed from the projected resistance zone after completing a breakout from the symmetrical triangle and reaching a significant monthly profit-taking area.
Our focus now shifts to the downside targets.
The 25,600 region remains our primary objective. If buyers fail to defend that area, the probability of a deeper correction toward 22,360 will increase considerably.
As always, we will continue monitoring both technical developments and macroeconomic conditions while updating our outlook as new price action unfolds.
Disclaimer
The information in this article reflects personal opinions and market analysis only and does not constitute investment advice, investment marketing, or a recommendation to perform any financial transaction. All market activity involves risk and is the sole responsibility of the individual investor.