NASDAQ 100 CRASH

The Indices Reached the Exact Profit-Taking Zone We Forecasted in Advance and the Sharp Decline Began After the Employment Report
Nasdaq 100 Collapses More Than 5% in a Single Day
In our previous market analysis, we warned that U.S. equity indices had reached major historical resistance and profit-taking zones following an extended and aggressive rally.
After the release of the latest U.S. Non-Farm Payrolls report, the exact scenario we projected began to unfold. Heavy selling pressure entered the market and the Nasdaq 100 dropped more than 5% in a single trading session.
In our view, the current decline is not merely a temporary reaction to economic data, but the beginning of a broader correction that had been building technically for a long period of time.
Historical Technical Pattern Signals Further Weakness
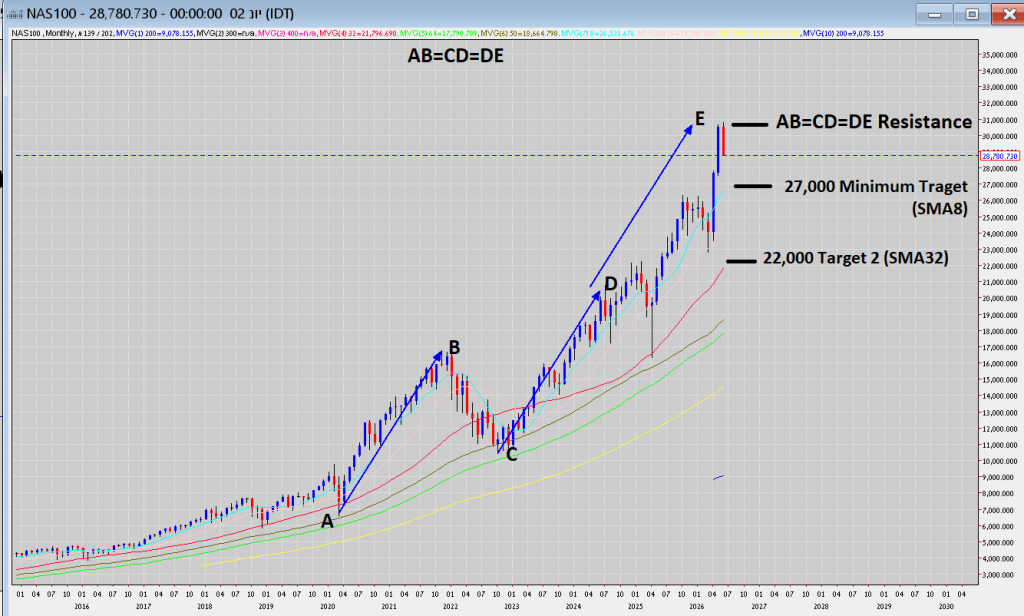
On the monthly Nasdaq 100 chart, the index reached a major long-term AB=CD=DE resistance structure, a pattern that historically represents a powerful exhaustion and profit-taking zone.
In addition, after the aggressive rally of recent months, price became significantly overextended from long-term moving averages, greatly increasing the probability of a sharp corrective move.
At this stage, we expect the first phase of the decline to continue toward a test of the monthly 8-period moving average, located near the 27,000 level.
If that support area fails, the market could enter a much deeper and faster decline toward the monthly 32-period moving average, currently located near the 22,000 level.
Why We Believed the Market Was Entering a Dangerous Zone
Over recent weeks we identified several warning signals indicating that the market was reaching extreme conditions:
Extreme separation from long-term moving averages
Arrival into major historical resistance zones on higher timeframes
Excessive optimism across the technology sector
Weakening momentum despite continued price advances
Risk-to-reward conditions becoming increasingly unattractive after the sharp rally
In addition, the strong U.S. employment data increased concerns that the Federal Reserve may struggle to cut interest rates quickly, creating significant pressure on growth and technology stocks.
Our Outlook Going Forward
At this stage, we continue to project additional downside potential of at least another 5% across major U.S. indices, with the possibility of a much deeper correction if key support zones begin to break.
Historically, after prolonged periods of aggressive upside momentum, markets tend to correct in multiple waves rather than through a single-day decline.
Therefore, even if temporary rebounds appear in the short term, we believe the broader risk of continued weakness remains elevated.
Key Areas We Continue to Monitor
Nasdaq behavior around the monthly 8-period moving average
Whether the 27,000 support area can hold
Volatility expansion in the coming trading sessions
Capital flows into defensive and safe-haven assets
Market reaction to upcoming inflation and interest rate data
Disclaimer
The information in this article reflects personal opinions and market analysis only and does not constitute investment advice, investment marketing, or a recommendation to perform any financial transaction. All market activity involves risk and is the sole responsibility of the individual investor.