Triangle Pattern: Trading Guide
 July 10, 2026 · Nitsan
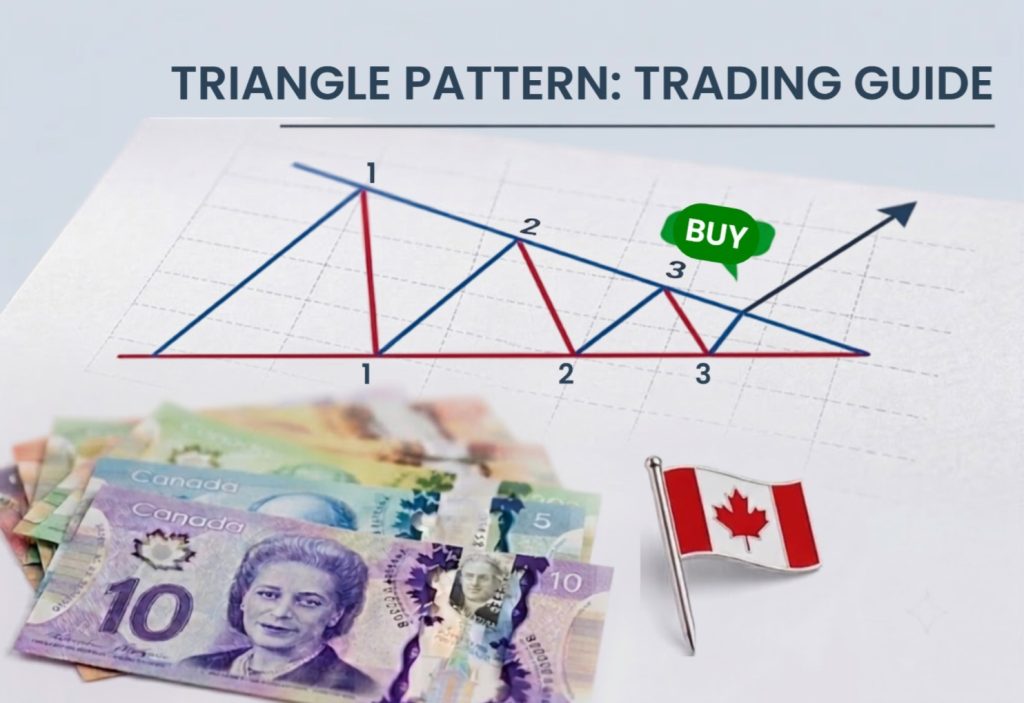
Do you want to know how to identify massive market moves before everyone else? In the world of technical analysis, chart patterns are the most powerful tools for doing exactly that. One of the most reliable, popular, and effective structures for trading with the price momentum is the triangle pattern. This pattern represents a period of intense struggle and compression between buyers and sellers, which eventually explodes with high velocity. In this guide, we will cover how to identify the pattern, how to utilize supporting indicators, and exactly when to enter the trade to maximize profits while minimizing risk.
What is a Triangle Pattern and How is it Built on the Chart?
A triangle pattern forms when the price of an asset enters a phase of converging consolidation. During this period, price volatility gradually shrinks, and the price oscillates between two key trendlines. The first line is the upper trendline, which represents resistance and connects the lower highs. The second line is the lower trendline, which represents support and connects the higher lows.
For the pattern to be considered highly reliable, we look for at least three distinct touching points, points one, two, and three, on the trendlines, both on the support and resistance sides. This compression signals that the market is like a coiled spring wrapping tighter and tighter. A powerful breakout is usually just around the corner, occurring right after point three.
Which Tools Will Grant You Confidence and Why Should You Combine Indicators?
Trading based solely on trendlines can be risky. To significantly increase the win rate of the setup, we always look for additional confirmations to support our thesis.
The first tool is the support of moving averages. Prior to the breakout, we want to see key moving averages, such as the 20 or 50 period moving averages, sitting directly below the price. This serves as a dynamic floor of support, actively pushing the price upward.
The second tool is multi-timeframe analysis. It is always wise to zoom out and check the bigger picture. If you are trading the pattern on a 1-hour chart, ensure that the general trend on the 4 hour or daily chart is strongly bullish. Trading in the direction of the higher-timeframe trend heavily skews the probabilities of success in your favor.
What is the Practical Blueprint and How Do You Manage the Entry, Stop Loss, and Targets?
The great secret of professional traders is not just knowing what to buy, but knowing how to manage the trade with mathematical execution and complete discipline. Here is the exact trading strategy for the triangle pattern.
How do you identify the entry point and the trigger for the trade? We never guess which way the price will break. We wait patiently for point three, and then look for a clean candle close above the upper resistance trendline. A candle closing outside the boundary is the official validation that the buyers have won and momentum is on our side. This is your signal to execute a buy order.
Where do you place the stop loss to protect your capital? Responsible trading mandates strict risk management. The stop loss order, your exit plan if the market turns against you, should be tucked safely below the last support point inside the triangle, which is the swing low of point three. This way, if the breakout turns out to be a fakeout and the market reverses, you exit the trade with a small, controlled loss before any real damage is done.
How do you define profit targets and execute a two-stage scale-out? To capture a guaranteed profit while still leaving room to ride a massive macro extension, we split our targets into two stages. The first take-profit target is set at the level of the new high, meaning the previous major peak at point one where the triangle structure began. Reaching this point is a classic, high-probability target where you should secure a significant portion of the position (e.g., 50% to 70%). The remaining portion of the trade is left to run toward even higher prices, utilizing a trailing stop to ride the newly established market momentum and squeeze the absolute maximum out of the trend.
How Does it Look in Real-Time and How Does the Pattern Manifest in the Field?
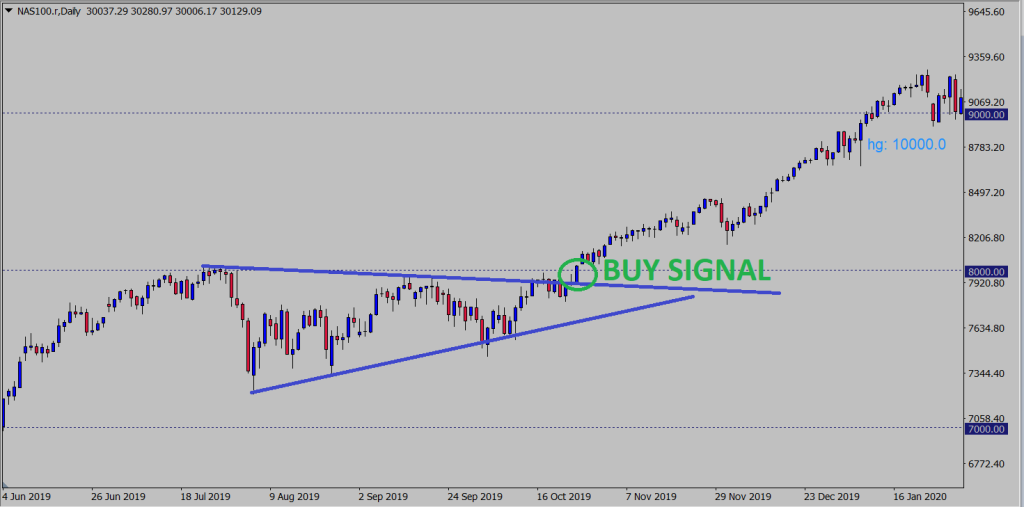
To better understand how this pattern plays out, let us take a look at the daily price chart of the Nasdaq 100 index attached here as our first example. In the chart, you can clearly observe how the price enters the compressing structure of the triangle, getting rejected repeatedly between the converging trendlines.
When the moment of truth arrived, right after the necessary key points were established, a powerful breakout candle closed above the upper trendline. This breakout close generated the official buy signal, circled in green. Notice what happened immediately after: the moment the buyers established total control beyond the boundaries of the triangle, the price stopped consolidating and began to skyrocket upward with strong momentum, producing a long, steady, and sustainable rally. This is exactly the power of entering a trade perfectly aligned with fresh momentum.
Does the Pattern Work in the Opposite Direction and How Can You Exploit it for Short Trades?
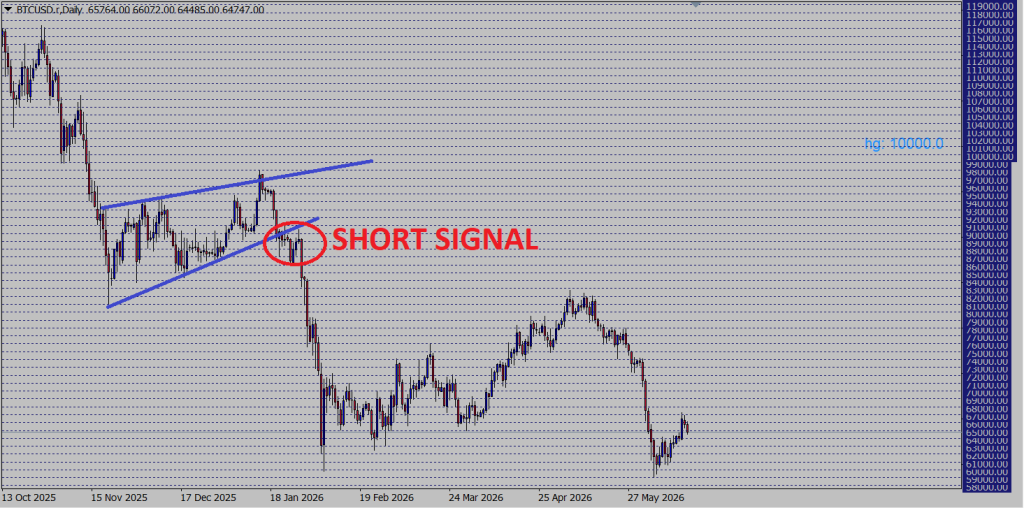
To prove that the triangle pattern is highly effective and robust under any market condition, let us examine a second example, this time on the Bitcoin daily chart, showcasing a short (sell) trade. As seen on the graph, the price was moving inside a clear compression structure, but this time it was the sellers who demonstrated dominant strength, driving the market downward.
The moment the daily candle closed cleanly below the lower trendline, the official short signal was triggered, circled in red. Immediately following the breakdown of the support line and the confirmation of bearish momentum, the price experienced a sharp and rapid plunge downward. This example proves that once you master the principles of compression and breakout, you can generate profits from this pattern whether the market is rising or falling, as long as you maintain strict execution discipline and proper risk management.
How Does the Triangle Pattern Predict Sharp Moves in Real-Time Around News and Economic Data?
Before

After:
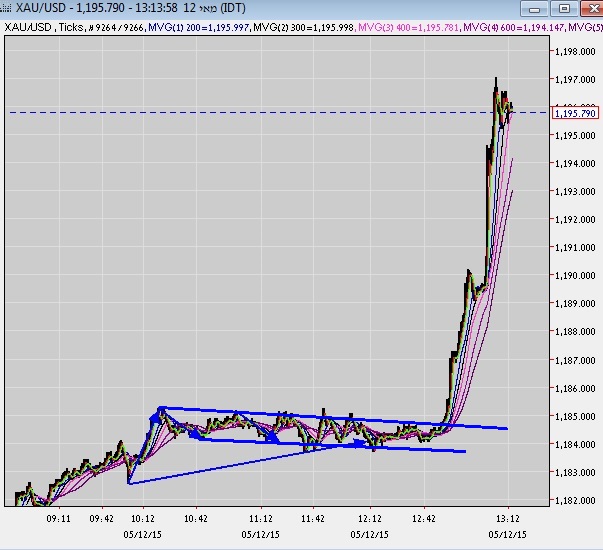
A third and fascinating example is the use of the triangle pattern on ultra-short timeframes, such as a Tick Chart which displays every transaction individually. These structures form very frequently right before the release of a major news announcement or an important economic data print. In such scenarios, the market enters a state of high alert and holds its breath, which translates on the chart into the familiar compression structure of a triangle.
An example of this can be seen in the first chart of Gold, where the price is completely locked inside a distinct triangle, waiting for a breakout. Notice how the moving averages, those colorful lines on the screen, are also converging tightly along with the price inside the pattern.
When the moment arrives and the economic data is released, the compression is unleashed with immense force. As seen in the second gold chart, the moment the price breaks out of the triangle in an upward direction, the move is violent, rapid, and backed by massive momentum. It produces a massive extension that allows for a quick and sharp profit for anyone who identified the breakout in time. This is an excellent way to see how even on the most immediate intraday horizons, the core principles of compression and breakout function with the exact same power and generate extraordinary trading opportunities.
The Complete Guide to Breaking Into Wall Street
What is the Bottom Line to Take Away From This?
The triangle pattern is a gift for momentum traders. It allows you to sit patiently on the sidelines while the market rests, and join the ride precisely at the moment the asset explodes. Remember that waiting for the candle close above the trendline, integrating moving averages, and maintaining iron discipline with your risk management are what separate a gambler from a professional, profitable trader.
Disclaimer: Nothing in this article constitutes financial advice or investment recommendations. Trading in financial markets carries a high level of risk and can result in the loss of capital.