Swiss Franc Momentum Analysis and the Chart Breakout Opportunity
 July 13, 2026 · Nitsan
The foreign exchange market is at a boiling point, and one of the most compelling pairs to watch right now is the US Dollar against the Swiss Franc (USD/CHF). The combination of central bank decisions, global geopolitical tensions, and the technical structure forming on the chart creates a classic opportunity for momentum traders who excel at executing a structured game plan. In this guide, we will break down what is happening behind the scenes of the Swiss Franc, how the price has carved out a flawless triangle pattern, and exactly how to manage the trade ahead of the next major move.
What Are the Key Central Bank Headlines and Global Drivers Moving the Franc?
The Swiss National Bank (SNB) recently declared an increased readiness to actively intervene in the foreign exchange market to curb excessive strengthening of the local currency, which harms Swiss exporters. Weak economic data released domestically leaves the door wide open for aggressive monetary steps. On the other hand, global geopolitical tensions and security events in the Middle East are driving investors worldwide to seek safe-haven assets, prompting heavy accumulation of the Swiss Franc. This fascinating tug-of-war between the Dollar and the Swiss Franc is exactly what is creating the massive compression currently visible on trading monitors.
How Did the Price Carve Out a Classic Triangle Pattern on the Chart?
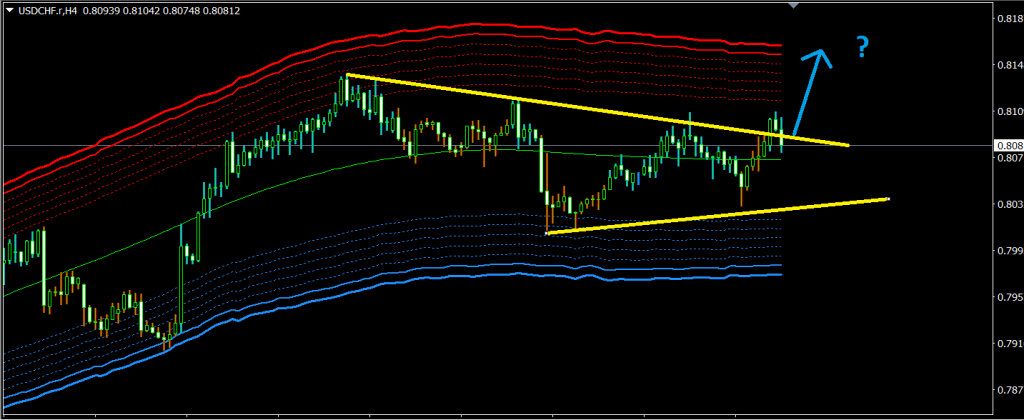
Shifting the focus to the price chart of the currency pair reveals a highly impressive technical picture. The price has established a wide, distinct symmetrical triangle pattern, consolidating inside it in a classic fashion for an extended period. Throughout this consolidation phase, the price was rejected time and again with pinpoint accuracy off the trendlines, producing clear touchpoints on both the lower support line and the upper resistance line. The price swings gradually narrowed, volatility compressed into the apex of the triangle, and the financial spring coiled to its absolute limit. This classic consolidation within tight boundaries is the most prominent signal that the market has built up immense energy ahead of an impending explosion. However, it is vital to keep in mind that if the price does break out and print a new high, it is highly likely to encounter a certain degree of resistance and profit-taking by traders due to the presence of the red channel waiting at the extreme edge.
What Happens at the Moment of the Breakout and Where is the Price Expected to Go Next?
Following the period of anticipation and compression, the pattern’s moment of truth arrived. As can be observed right now, the price executed a decisive breakout and closed above the upper line of the triangle. A candle close above the resistance line is the most critical technical confirmation that the buyers have taken the reins and that momentum has shifted in their favor.
Should the pattern function as expected and realize its technical potential, the price is projected to launch into a powerful upward rally and extend toward a new high, surpassing the previous peaks where the pattern originally began. Such a breakout generates an ideal entry opportunity, as the fresh momentum actively drives the market forward.
How Do You Manage the USD/CHF Trade Safely?
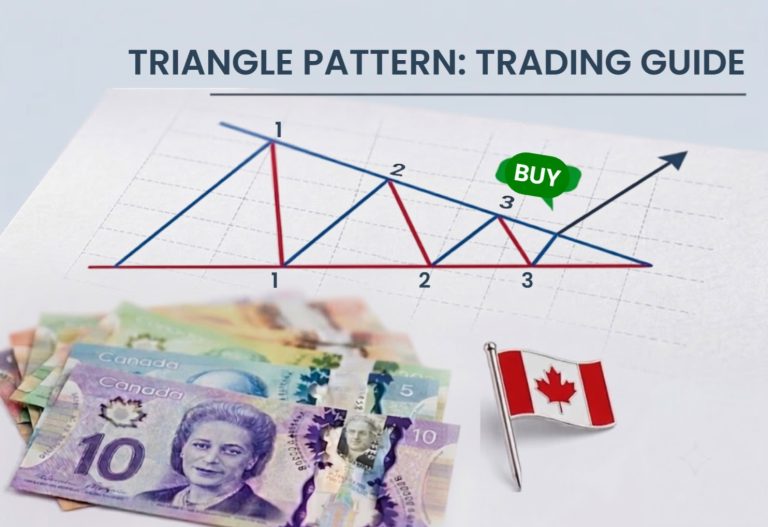
Triangle Pattern: Trading Guide
Trading a triangle pattern demands iron discipline and strict risk management. Our official trigger was received with the candle close above the upper trendline, signaling the green light to open a long position. Nonetheless, we never enter a trade without protection. The stop-loss order, which shields us from a potential fakeout scenario and a rapid market reversal, should be placed safely below the final support level formed inside the triangle prior to the breakout.
To execute this intelligently, we split our profit targets into two stages. The first take-profit target will be placed around the new high, which represents the previous peak level where the structure originated. Reaching this milestone will allow us to lock in a substantial profit directly into the account. The second portion of the position will be left to run toward even higher prices, utilizing a trailing stop to capitalize on the full scope of the long-term trend developing in the pair.
What is the Bottom Line to Take Away From This?
The price action in the US Dollar against the Swiss Franc is a perfect practical lesson in technical analysis and momentum trading. The classic consolidation within the triangle and the current close above the upper line provide all the signals that professional traders have been waiting for. Maintaining patience, entering based on strict confirmations, and mathematically managing your profit targets and risk are the absolute keys to turning this opportunity into a winning trade.
Disclaimer: Nothing in this article constitutes financial advice or investment recommendations. Trading in financial markets carries a high level of risk and can result in the loss of capital. It is emphasized that the author may hold long or short positions, or execute trading operations in the financial assets mentioned in this article or any other asset, and this information should not be viewed as an incentive to act.